How has gold done over the 10 last years?
A comparison of the gold price in dollars and rands over a 10-year period
Read more
A comparison of the gold price in dollars and rands over a 10-year period
Read more
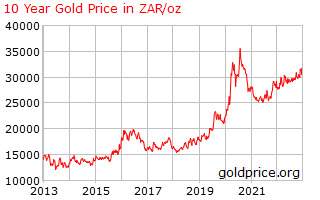
The 10 year period is a good long term period. Here are two charts, one in dollars and the other in rand.
Gold in dollar terms?
If you were a US citizen, you would be very disillusioned. The gold price for an ounce is now $1800, ten years ago it was $1700. That is a mere $100 or 6% growth over the period. Hands up if you think gold is a good investment on this basis. I have to agree, it is a shocker!
Gold in rand terms?
For South Africans, the rand chart reflects that 10 years ago gold was R 15 000 an ounce. Today it is R 31 000. This is a whopping R 16 000 growth or 106% return on investment.
Why has gold done so much better in rand terms?
SA has used the printing press to devalue the rand. The more paper money there is in circulation, the more the currency devalues.
Has the US not
printed many trillions of dollars now lately?
It has indeed. So why is there no reflection of this in the gold price? Maybe it has something to do with the US holding the world’s reserve currency. As long as confidence in the dollar remains, they will do alright. Time seems to be rapidly running out.
What will
happen when the world’s monetary system implodes?
That is when gold and silver will be the anchor again to our financial system, as it always has been since man’s existence (Genesis 2: 10 – 12).